What is resistance?
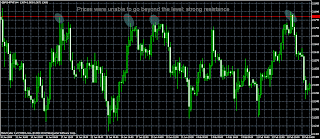
Technical resistance is the topic of the post. I wrote on support last week and want to give a few ideas on the opposite of it now. I think I’d better give you a chart of gbp/chf first and then go on talking about the theoretical and practical aspects of the topic.
As you may see from the chart, gpb/chf pair visited 2.1800 level four times and failed to go through upwards. So, when the price going upwards and is unable to break some level to continue their rise, that level is called resistance. If the level is visited many times and holds the level becomes very strong resistance. We could interpret the fact in a very simple way. At some point the number of bears becomes bigger than the number of bulls, or the amount of sell orders become much bigger than the amount of long orders and this stops prices from rising.
Where you can expect resistance in a range?
We can expect resistance when a security becomes overbought in a range. This happens quite often as in a range prices moves between support and resistance and they become overbought quite fast due to the fact that the distance between support and resistance in a range is usually very small or at least it becomes smaller as the time goes by and finally price breaks out of its’ cage either upwards or downwards. The condition of being overbought is best defined by RSI or similar technical indicators. I prefer using 4 and 8 hour charts to determine whether some security is overbought or oversold in a given range.
Possible ways to trade resistance
If RSI values on 4 or 8 hour chart goes beyond 70 or at least touches 70 we may assume that prices for that security are overbought and the time of reversal is near. If you add a filter for your upcoming trading decisions such as divergences, you start seeing the time for a reversal more clearly. Then you start searching for some stronger support where you can place your short orders below. It is even better when you see that some important news is coming quite soon. Then you can definitely place a sell stop order below the support. Finally it is broken and you go down with the price. That’s how you trade reversal at the resistance.
Wait for candle clusters on daily charts
Read my previous post:
Bullish expectation for eur/cad on friday
Disclaimer
Trading financial markets carries a high level of risk, and may not be suitable for all investors. All information on the blog is of educational nature and cannot be considered as advice, recommendation or signals to trade in any financial markets.


