Range trading is the topic of the post on the ‘Trend’ blog today. I am sure that most of you know what it is, but for those who don’t I would ask you to look at the chart below before I go on giving a definition of it and some of my thoughts about trading it.
What is a range?
I hope that just by looking at the chart you could easily identify what a range in any security is. It is the high and low levels of a security that it stays within for a given period of time. Depending on the time frame it can be a few hours or a few years. After a prolonged trend securities usually lose steam and fall into ranges. In the beginning they are usually very broad. That’s when prices set the high and the low levels it will be trading in the nearest future. It then stays within the boundaries for some time, till they are broken and a new trend begins.
How to trade a range?
When a high and a low established in a range, you trade reversals at those extreme points (support and resistance). When the price of a security approaches resistance you wait for opportunities to go short and when the price of a security approaches support you wait for opportunities to go long. As reversals happen near those important levels, when you see the price approaching them you have to be on alert.
Things to look for before entering a trade in a range
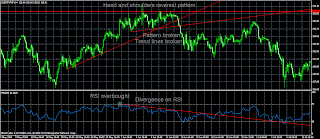
What do you wait for? You wait for 123 patterns, head and shoulders patterns, clusters of candles, candle patterns that would indicate a reversal (dojis, engulfing candles and etc.) overbought and oversold signs on RSI and other indicators that are used in a range, divergences, a break of some important sma, such as 200 or 50, a break of a trend line, important news releases and many more.
Eur/jpy example range trade on 4 hour chart
You can look at the same eur/jpy pair4 hour chart, in the same range that was shown on a daily chart before. You will see that on the 19th of May 2009, the pair found support at the lower part of the range and broke into a swing upwards. After three weeks it peaked. However, you could have spotted those peaking signs. The first sign would have been RSI reaching a value of 70 (overbought level), then RSI showing divergence, then head and shoulders pattern formed and finally trendlines broken. At the break of the neckline of head and shoulders (I wrote on the topic yesterday) you would have gone short.
You finally trade a breakout of a range
All ranges are finally broken and prices start trending again. You can prepare for that by placing buy stop orders above the upper part of the range and sell stop orders below the lower part of the range. When the range is finally broken you automatically enter a breakout trade and go with the trend (if the breakout is not false).
Read my previous post:
Disclaimer
Trading financial markets carries a high level of risk, and may not be suitable for all investors. All information on the blog is of educational nature and cannot be considered as advice, recommendation or signals to trade in any financial markets.


