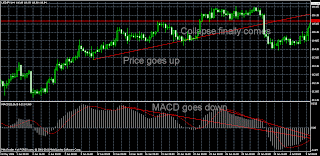
Divergence is the topic of the post. I have used the term in a lot of posts of mine and want to talk about it in more detail today.
What is divergence?
I would define it as a descrepancy between price action and indicator action. It means that price is moving in one direction (let‘s say up) and indicator starts moving in the opposite direction (down). This is a divergence between the price of a security and the values of indicator for the same security. The most popular indicators that are used for this are MACD, RSI and Stochastics. I prefere MACD and RSI.
Start copying popular investors of eToro
Start copying popular investors of eToro
Types of divergences
If you have read anything on the topic you should know that there are basically two types of divergences and they can have two subtypes of their own. Let us define them.
The two types of divergences are Regular Divergence and Hidden divergence. They have two subtypes: one for an uptrend and one for a downtrend.
Regular divergence
I. Price is making news highs and indicator is making lower highs (in a swing up).
II. Price is making new lows and indicator is making higher lows (in a swing down).
Hidden divergence
III. Price is making a higher low while indicator is making a lower low (in a swing up).
IV. Price is making a lower high while indicator is making a higher high (in a swing down).
How to apply regular divergence
Let us look at regular divergence first. Regular divergences are best used in range bound markets and it gives us a sign that a market might reverse soon. It is not very good in longer term trends, because it produces too many false signals before the market finally reverses. When you start seeing a divergence (let‘s say on 4 hour chart) in a range bound market you should start searching for opportunities to enter a position in the opposite direction market is at that given period of time. You should not hurry to jump into a trade right when you see a divergence, but wait for reversal candles, broken support levels, news releases or 123 patterns on smaller time frames to tell you that it is time to take a trade.
How to apply a hidden divergence
However, when a trend starts you should not follow these kind of divergences, but rather play against them. What you want to look for in a trend is a hidden divergence. Hidden divergence usually shows overbought levels in a downtrend and oversold levels in an uptrend. It means that during corrections in a trend it shows you the level when correction or counter trend move should end and it is time to get back into a trend again. In an uptrend, a price of a security suddenly starts collapsing but does not reach previous low. However, indicator shows lower values than the values of the indicator during previous low. The same is true for downtrend. The price of a security rallies but does not reach previous high. However, indicator shows higher values that the values of the indicator during previous highs. Again, what you want to see before jumping into a trend trade again are: reversal candles, broken support levels, news releases or 123 patterns on smaller time frames.
Conclusion
So, when you see that a price of any security is in a range you use a regular divergence to trade reversals in a market. Those usually happen at the ends of the range (important support and resistance levels). When you see that a price of any given security is in a trend you use a hidden divergence to trade continuation of a trend. This usually happens at the end of a counter trend move. Good luck in trading divergences.
Read my posts:
Disclaimer
Trading financial markets carries a high level of risk, and may not be suitable for all investors. All information on the blog is of educational nature and cannot be considered as advice, recommendation or signals to trade in any financial markets.


